The Wave Model of Event Purchasing
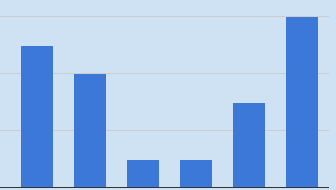
A general trend we have observed is a “wave” pattern in online ticket purchases. There is commonly stronger online ticket purchases at the beginning and end of a campaign. When graphed out, this looks somewhat like a wave. You will see higher purchase rates towards the beginning, followed by a drop off, with a final spike towards the end. There is variation in which spike is more prominent (the one at the start or the one at the tail end of your campaign), but generally you will see that your highest online ticket sales come towards these points. Below is a model of this pattern, followed by five examples of real Strong Coffee event campaigns to demonstrate this pattern.
The Wave Pattern
X-axis represents time (days, weeks, month), Y-axis represents purchases
Sample Event #1
What you will notice in this example is a good start to online ticket purchases, followed by a bit of a dip and then a very strong finish.
Sample Event #2
In this example, there is a very strong start to the campaign, followed by a dip in sales, and then a stronger finish.
Sample Event #3
This event starts out with an initial spike, then experiences a slow down period with online ticket purchases heavily picking up towards the end of the campaign.
Sample Event #4
Contrary to Sample #3, this even starts off with very strong online sales, followed by a small slow period before a final spike occurs towards the end of the campaign.
Sample Event #5
This one’s perhaps the hardest to see, but there is the same wave framework as all the other samples. There’s a strong start to online purchases, followed by a bit of a downswing before the final large spike in sales occurs in the last measurement period.
As shown above, this wave structure held through a number of different campaigns. Each of these campaigns had different budgets, audiences, time-frames, sizes, and reaches. Yet, the wave pattern is still noticeable throughout all of them. You may notice throughout each of these campaigns some random spikes and surges and these are attributed to social media postings, e-newsletter deployments, and offline or online media buys.
What time of day do most purchases take place?
For our campaigns, almost 2/3rds of online purchases occur between 6pm and 2am. Understanding this trend helps with structuring posts on social media. This goes hand-in-hand with what we discussed in last week’s post about peoples’ habits on Facebook. Advertising for your event on social media should be done in time to utilize this 6pm-2am purchasing period.
Another Finding
Another neat finding we came across was that there are many instances of people registering in the morning, abandoning their cart and then coming back later (in the evening) to complete the purchase. Often times, these micro-conversions are over-looked. However, this finding shows the importance of appreciating micro-conversions. Not every micro-conversion is going to turn into a purchase, but there are many instances where these micro-conversation turn into conversations and ROI. This trend fits in line with other types of sales and marketing. People will think about making a purchase, sit on the idea for a while and then come back later to complete the purchase. Also, people might start the purchase, realize they don’t know how many seats they need exactly, and then come back later. These are just two ideas that could explain this trend, and I’m sure you can think of other plausabilities. The point being, don’t discredit the importance of partial completions and micro-conversions.
Other Things to Consider
One factor that hasn’t been discussed yet is advertising. If you’re using print, radio, digital, or television advertising this will have an effect on the wave pattern. Advertising provides an x-factor in terms of online purchasing. The wave pattern can change depending on the amount of paid advertising vs. organic promotion you put into the campaign and when this paid advertising is placed. As previously mentioned, this is shown with the random spikes sporadically appearing on some of the charts above.
If an event is a one-time or weekend event, you will generally want to make tickets available for online purchase three to four weeks in advance. If its a bigger event, you will want to bump that date back a couple months before the event. In either case, the wave pattern will more than likely take shape. Advertising your event will have an effect on this wave, but structuring your advertising to take into consideration the natural wave pattern of event purchasing can help with online ticket sales. This is to say, you might want to put a good chunk of your advertising budget into the beginning and end of your campaign period. Finally, take into consideration the high rate of purchases that occur between 6pm and 2am, make the most of this data when planning your next social post about an event with online purchasing.
Recent Posts
Navigating the Digital Buying Cycle: Strategies for Modern Consumers
In today’s fast-paced world, where information is just a tap away, the buying cycle has transformed dramatically. Gone are the days when consumers...
Digital Marketing Strategies in the Off-Season
Ah, the off-season. For some businesses, it’s a time to kick back, relax, and sip on a well-deserved latte. For others, it’s a...
How ChatGPT is Transforming Online Search Behaviour
In the ever-evolving landscape of digital information, the way we search for answers is undergoing a seismic shift. We got used to searching...


