
The internet is filled with useful tools designed to help make our marketing lives a bit easier. Some of the most useful ones come from a little company called Google. Google collects mountains of information about what people do online, what people search for, what they click on, etc.
Google Trends is a free tool that offers insights into the trends of Google searches – not necessarily showing us how many people search for something in a day, but which searches are most popular and when. This data is extremely useful for marketers because we can identify when people begin looking for things. If we’re selling ski packages, it would be handy to know when people in Canada start searching for them. Do they wait for the first snowfall or are they planning months in advance? Google Trends can give us those answers.
The tool also provides us with information about related searches, searches by location and searches by type (Google, Google Images, Google News, YouTube, etc.). We can also look at data from previous years and identify patterns in consumer behaviour from year to year. Pretty useful information huh?
Let’s look at a simple example and play a fun game.
Below is the data for the last 30 days of searches for two seasonal items (tis’ the season) – the “Grey Cup” (that’s the Canadian version of the Super Bowl) and Mariah Carey’s festive hit “All I Want For Christmas Is You”.
The lines on the graph don’t represent the exact number of searches but show “Interest over time”. Google explains “Interest over time” as…
“Numbers represent search interest relative to the highest point on the chart for the given region and time. A value of 100 is the peak popularity for the term. A value of 50 means that the term is half as popular. Likewise, a score of 0 means the term was less than 1% as popular as the peak.”
Let’s look at the “Interest over time” for these two items when searched in Google…
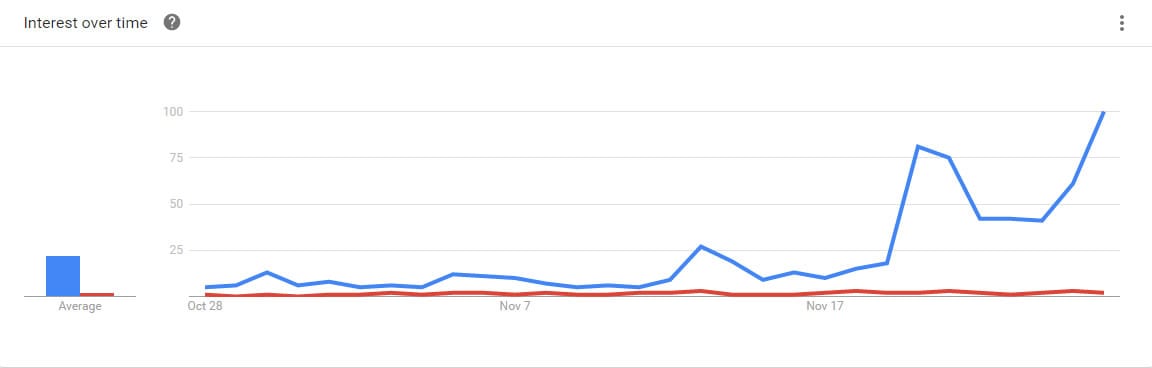
The blue and red stay pretty close until November 20th. Blue starts it’s upward trend and gets even higher throughout the week.
The second is the same search but in YouTube.
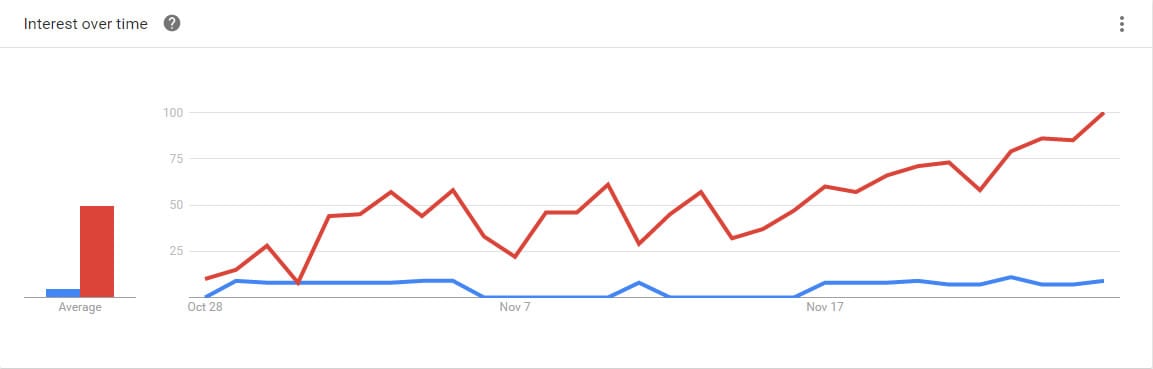
The story is very different on YouTube. Red is on an upward trend throughout November while blue stays pretty flat.
Based on the above graphics, can you guess which search phrase is red and which is blue? Click here for the answer.
Outside of playing a fun game, what have we learned? Instead of guessing what people are searching for and when they are searching for it, the information is readily available in Google Trends!
And just in case you’re not in the Christmas spirit yet…
Share
Recent Posts

July 3, 2025
Boost Business Efficiency with Google Workspace Automation Tools
Streamlining Your Business with Google-Based Automations Hey there, fellow business owners! If you’re like most of us, you probably feel like there just...
June 13, 2025
Harnessing Google Tag Manager for Better User Insights and Performance Tracking
Unlocking the Power of Google Tag Manager: Simplifying Tracking and Understanding User Behavior Hey there, fellow business owners! If you’re navigating the digital...

June 13, 2025
AI Max: Transform Your Google Search Ads Strategy Today
Unleashing the Power of AI with Google Ads’ New AI Max Hey there, fellow business owners! If you’re anything like us at Strong...