
Year over year, digital advertising spend continues to grow as companies continue to shift marketing dollars to this growing medium. But as companies are pumping billions into digital ads, who is regulating everything? How rife are these ad exchanges with fake traffic and clicks, and further to that, in who’s best interest is it to stop it?
Website owners benefit from addition ad revenue, marketing agencies benefit from hitting impression/click goals at low prices and ad exchanges benefit with inflated numbers and increased ad dollars spent. Only the advertisers lose out, but the data is so convoluted, its nearly impossible to claim ‘fraud’ without data. And with this type of fraud evolving daily, its tough to determine even what click and impression traffic is actually real.
It is estimated that Methbot, a sophisticated click-fraud operation nets between $3-$5M per day from advertisers across the world. This is just one bot, and there could be many more out there on the web wreaking havoc unbeknownst to anyone. So the question becomes, how can we protect ourselves? In this post we’ll provide some simple strategies on spotting the tell-tale signs of ad-fraud, and provide insights on how to mitigate it.
The Problem
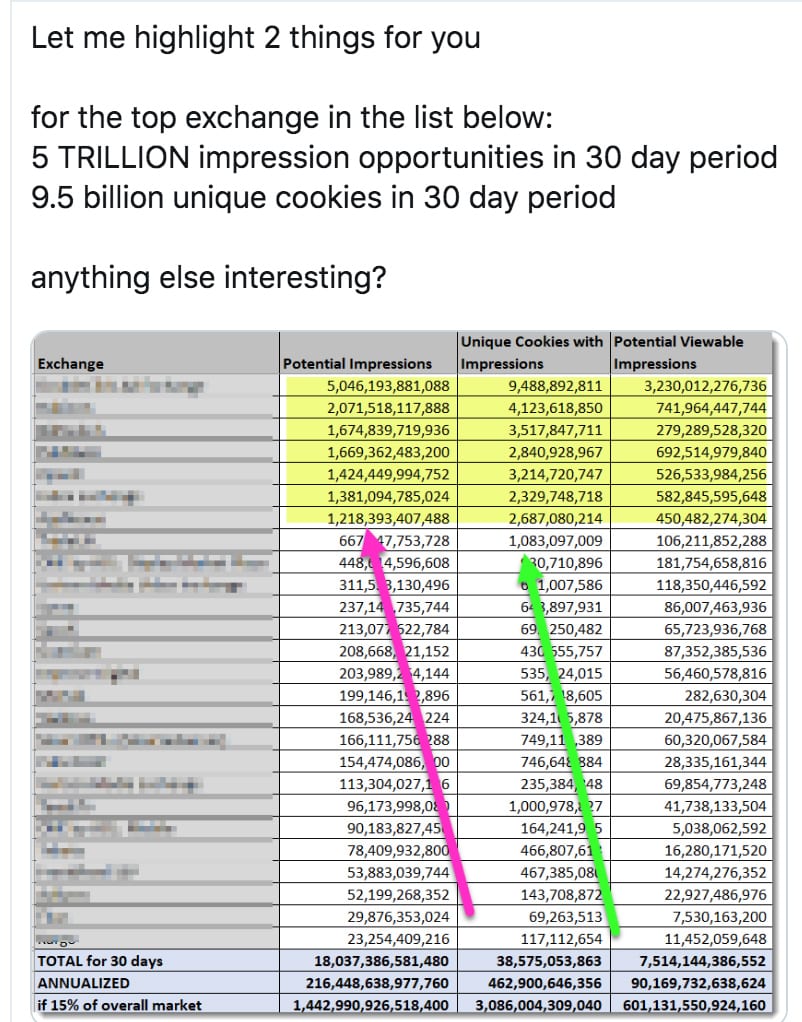 We did a deep dive into some data provided by “Dr. Augustin Fou” on Twitter, where they extrapolated that there are approximately 1.44 quadrillion potential ad impressions available per year on all ad exchanges worldwide. This seems like a lot, but back 9 years ago in 2011, Comscore estimated ad impressions in the USA alone at over 4.4 trillion. Now comes the fun part, when you divide this massive number by the number of people on the planet, you get a breakdown if over 5,000 ad impressions per day per man, woman, and child on our planet. That number is simply impossible. The only reasonable explanation for this is fake traffic and impressions. Its estimated ad fraud consumes 60%+ of all ad clicks and traffic today.
Naturally, you could then assume that as long as you weren’t running CPM campaigns (impression-based bidding), you’d be able to steer clear of all this crap traffic? Well, you’d be wrong… while this would be a helpful strategy in some regard, bots can do more than just visit a page, they can click, interact with your website, visit multiple pages, watch videos, fill-out forms, and even fake-buy products through clever scripts. So all targeting types are at risk, but CPM is by far the most targeted by these types of scammers.
Alright, now comes how we fight back…
The Solution
Agencies need to step up and put in safeguards to protect their clients. Ad Exchanges also need to step up and set measures for weeding out fraudulent traffic and punishing websites that are buying views. Clients need to demand accountability from their partners, and criminals need to be punished to help make changes in this industry. We are actually starting to see some accountability, but this is just the tip of the iceberg. Check out this recent lawsuit by Uber on exactly this topic.
So, how can we spot Ad Fraud in our data? In fact, it’s pretty easy…
Our Data
App Ads CTR
It’s a fairly well-known fact that the average expected click-through-rate on a display campaign is 0.1%. We recently ran a large display campaign that included app traffic, and this is what we saw:
- Google Android App CTR – 2.07%
- Apple iTunes App CTR – 1.12%
These results show us exceeding the national average by 21X and 11X respectively on our display campaigns. I mean, we’re good, but we’re not THAT good. So what gives?
We did a little research and found another advertiser with a similar issue. See this recent quote:
“Google’s Android operating system devices have a 29 percent higher invalid traffic rate than Apple’s iOS devices overall.”
This seems to suggest both Google and Apple are allowing app manufacturers to drive fake/accidental/forced clicks through their app designs to drive up advertiser’s costs, and pad their revenue. It also suggests Google is allowing app manufacturers to be a little more flagrant with their illicit attempts to do so.
While there is no guarantee that this traffic is bot traffic, it’s still something to watch out for as app designers make most of their money from advertising, so it’s in their best interest to trick you into clicks. This is also why we often omit app placements for our campaigns.
Weed out Troublesome Cities
Many posts have been written on the web as of late about specific cities showing up randomly in Analytics. Cities like Coffeyville, Boardman, Ashville, Irvine etc. There are multiple reasons for this traffic, some stemming from Amazon & other Data Servers, some from the city being positioned at the near geographic center of a country, but regardless the trend tends to be the same: Time-On-Site <0.01s. This is crap-bot traffic that can easily be omitted/weeded out through Analytics. We’ve also seen these cities show up in our ad campaigns, including ad campaigns not targeting the country from which those cities are in (United States) at all.
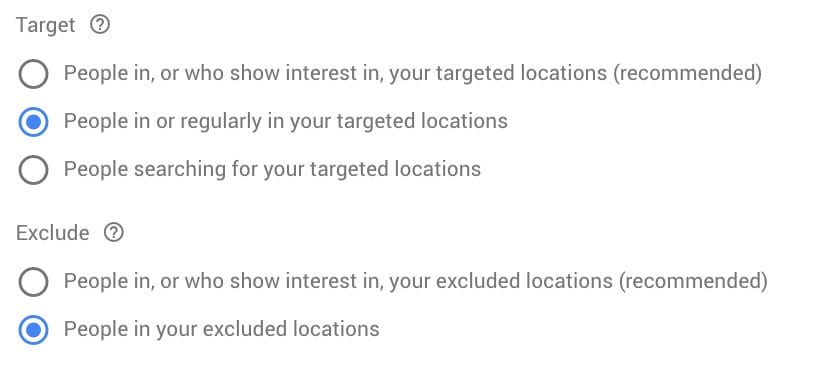
This took some digging, but within Adwords, the recommended setting for targeting includes the line “shows interest in your targeted location”. This is very vague and is Google’s way of throwing in additional traffic that rarely converts from outside your geographical targeting. We switch our campaigns to the 2nd option for tighter controls.
As an additional safeguard, it doesn’t hurt to exclude countries that you don’t want your ads to show in. We’ve been deploying this as an additional strategy after seeing random Asia-Pacific countries showing up in our ad reports despite the campaigns being targeted exclusively to Canada.
Remove Troublesome Countries
If you’re running National and International display campaigns it’s worth noting that ad fraud is more prevalent in specific countries and regions. In addition to the targeting methods described above, it’s worth noting that if you are advertising in any of the countries listed below, you are putting yourself at risk of ad fraud. Adding in troublesome countries as exclusions (as described above) will help avoid clicks from these areas.
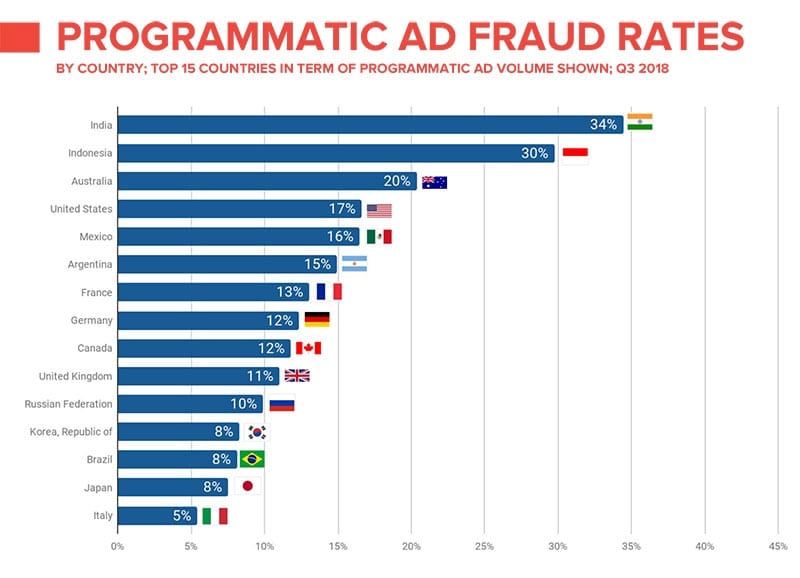
Pixelate Q2 2019 Data.
Build Conversion Based Campaigns
Most bots are designed to simply visit a website, or click an ad. By building campaigns not focused on these metrics, you can drastically reduce your ad dollar waste. By building conversion-focused campaigns you can force the ad platform-tools artificial intelligence (AI) to avoid problematic/cheap traffic.
On-Site Behaviour
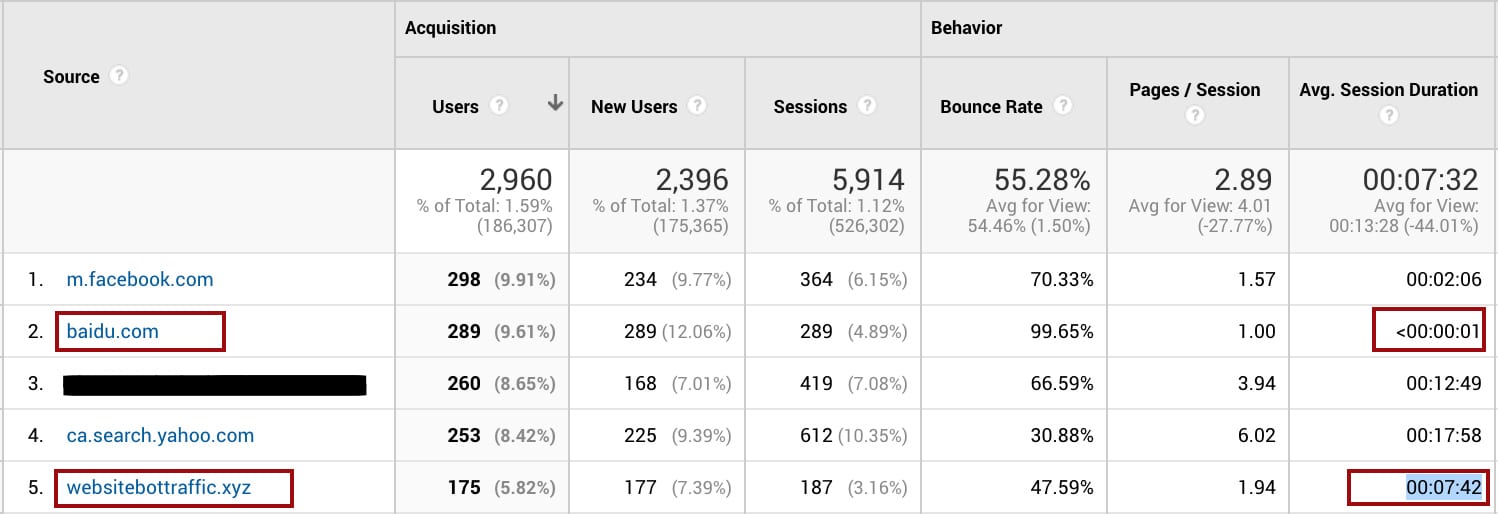
Analytics is a great source of data to help identify and weed out potential ad fraud. The telltale sign is time-on-site numbers being very low, bounce rates unusually high, but with a high quantity of traffic. So in other words, high-quantity, low quality. In our data, we’ve seen hundreds of clicks with time-on-site numbers of less than a second. We did some analysis and pin-pointed that data to a specific source, an ad referral, and then was able to block this ad traffic from our campaigns through geotargeting.
Inconsistent Data
Analytics and your ad platforms should be connected and working together to provide you with an accurate picture of your campaigns. Any major inconsistencies should be investigated and rooted out. For example, we recently acquired a client who was already getting 36,000 clicks a month on their campaigns, but their Website Analytics only showed approximately 11,000 visitors to the website. So the question was, where did the other 25,000 visitors go?
Turns out, they were running ads on Google Display Partners/Apps, Programmatic Ads and Facebook Network Partners, all infamous for generating fake/accidental clicks and riddled with bots. If your ad traffic isn’t making it to your website, there’s an issue either with the site not loading fast enough, or the platforms you’re advertising on. Investigating these inconsistencies can help save your clients thousands of dollars every month. Simply adding placement exclusion on our Adwords/Programmatic campaigns and disabling the Facebook Audience Network drastically improved this campaign performance.
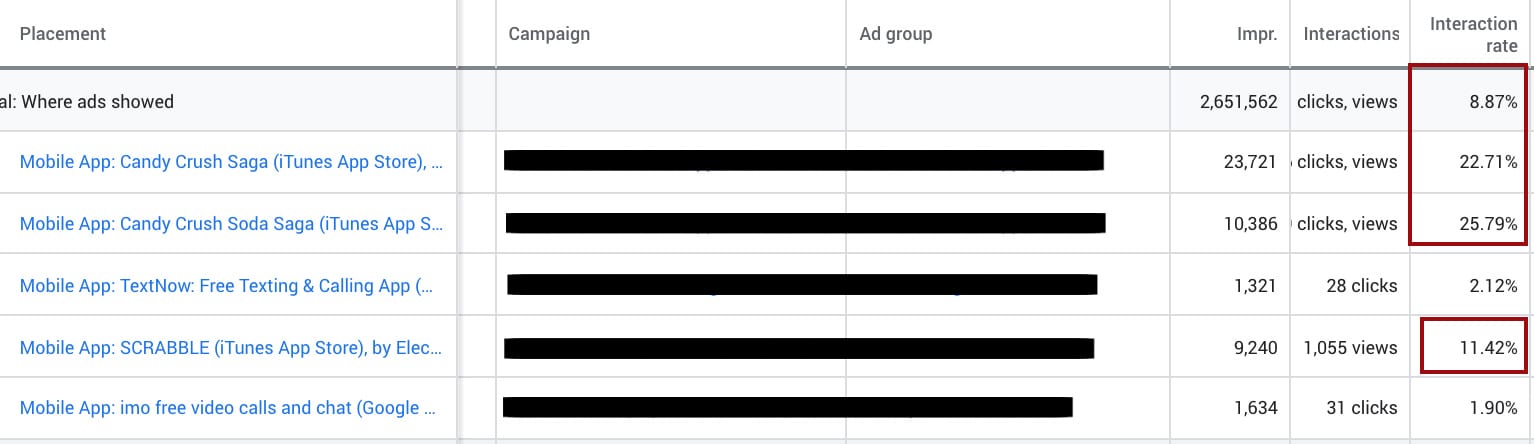
Review Ad Placements
High Ad placements CTR’s are your biggest clue that something is up. Unusually high CTR or Cost-Per-Clicks would be a tell-tale sign that the traffic isn’t valid. Google even has a system in place to refund advertisers for this type of fraud, but it doesn’t do a near good enough job. Review your placements, and review them often, add anything suspicious to your exclusion list to reduce fraud.
Exclude Problematic IPs
Grab a list of your website IPs from your web server, and look for problematic IPs. Use this list to then build IP Exclusion lists on your ad campaigns and Analytics traffic.
Ads.txt Implementation
By deploying IAB’s ads.txt you can help protect your ad campaigns from domain spoofing and other tricks scammers use by confirming which ad servers your ads are allowed to show from. Read more about this strategy online.
Build a Placement Whitelist
Many website placements are better than others, and over time you can differentiate the ones with more reasonable CTR’s and costs versus those manipulating advertisers to drive new clicks. By building and implementing a display whitelist, you can help save your advertising dollars for real, genuine clicks.
There are also third-party ad fraud tools available, but we’ve heard mixed results from these. We highly-recommend implement these safeguards before trying anything else to help out with your campaigns. Good luck!
Share
Recent Posts

July 3, 2025
Boost Business Efficiency with Google Workspace Automation Tools
Streamlining Your Business with Google-Based Automations Hey there, fellow business owners! If you’re like most of us, you probably feel like there just...
June 13, 2025
Harnessing Google Tag Manager for Better User Insights and Performance Tracking
Unlocking the Power of Google Tag Manager: Simplifying Tracking and Understanding User Behavior Hey there, fellow business owners! If you’re navigating the digital...

June 13, 2025
AI Max: Transform Your Google Search Ads Strategy Today
Unleashing the Power of AI with Google Ads’ New AI Max Hey there, fellow business owners! If you’re anything like us at Strong...